

The COVID-19 pandemic has made us familiar with the idea of a deadly threat that spreads invisibly. Polluted stormwater has a similar modus operandi.
Rainfall washes toxic chemicals from roadways, rooftops and parking lots, flushing the filthy mix into streams, lakes and marine waters. We mostly don’t see the pollution, except perhaps the occasional rainbow-hued sheen of oil. But like the virus, the tainted stormwater can be lethal, killing sensitive fish and other wildlife. It makes shellfish unsafe to eat and closes waterways for swimming and recreation.

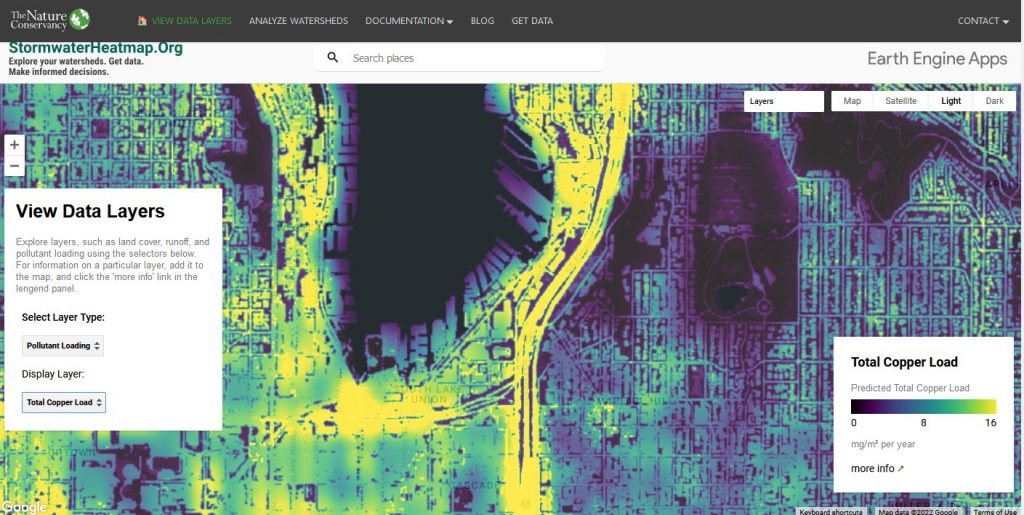
Now a first-of-its-kind heat map is making stormwater pollution visible across the 16,700-square-mile watershed that drains into Seattle’s Puget Sound.
The Nature Conservancy led the six year effort to create the free, interactive Stormwater Heatmap, which publicly launched in March.
The hope is that the tool will help guide efforts to prevent and clean up the stormwater, which threatens endangered salmon and orcas, among other creatures. It will make it easier to prioritize projects that promise the greatest environmental benefits.
Before this effort, we didn’t “even know where the worst places are in this landscape, or where pollution is generated,” said Emily Howe, the Nature Conservancy lead scientist on the project.
Stormwater is the No.1 pollution source harming Puget Sound. The pollutants come from vehicle exhaust, leaking oil, metals shed from brake pads and tires, and pesticides and fertilizers. All of the hard surfaces in urban landscapes prevent water from soaking into the earth as it would naturally, instead sending it racing directly into waterways.
What makes the map particularly powerful is the ability to look at the entire watershed to find regional pollution hotspots while also being able to zoom in to a street-level view to help target neighborhood efforts to construct rain gardens and other stormwater solutions.

“The Stormwater Heatmap levels the playing field and gives everybody in Puget Sound really high quality data and high quality science about where to build projects,” said Christian Nilsen, an engineer with Geosyntec Consultants who led the technical development of the tool.
With the map, he added, “more effort will be towards solving the problem than collecting data and doing the planning and figuring out where the problem is.”
Some details about the Stormwater Heatmap:
- The map incorporates 29 data sources, using a suite of Google tools including BigQuery, Google Earth Engine and Google Cloud to manage the information.
- The map features the three main categories of layers: land cover (roadways, forests, etc.); hydrology, such as rainfall; and pollutants such as metals, nitrogen and phosphorus.
- Developers used machine learning and images specific to the Pacific Northwest to train an algorithm to precisely identify the different kinds of land cover.
- Traffic is closely tied to pollution levels and essential data for their map, but all of the information is “closely guarded proprietary data,” Howe said. It was the only data set they had to pay for.
- The tool includes detailed historic, current and future climate-impacted precipitation data run through a hydrology model, generating 30 billion rows of data.
- The land cover data gets down to 1 meter square resolution.
The Nature Conservancy financed the effort, relying on donations primarily from Boeing and the Paul G. Allen Family Foundation. The initiative cost approximately $300,000, not including the nonprofit’s own staff time.

Project participants included Geosyntec, Washington Department of Fish and Wildlife, National Oceanic and Atmospheric Administration (NOAA), Aardvark Design Labs and Cheva Consulting.
The tool’s creators imagine a variety of users including local governments responsible for monitoring and cleaning stormwater; conservation groups planning restorations, and Native American tribes working on salmon recovery.
Officials with King County have already used the hydrology data set to quickly identify blocked salmon streams, saving time and money that would have otherwise been spent building a model and doing an analysis.
The team behind the Stormwater Heatmap made the development process transparent and open sourced, Howe said. They plan to publish their methodology in a peer-reviewed journal.
The project has generated interest from British Columbia, California, the East Coast and as far away as Australia. While each region as its own data sources and particular challenges, the effort could be replicated.
“Definitely the methodology can be applied anywhere,” Nilsen said.